Analysis
The Analysis tab turns synced QuickBooks data into CFO-ready financial signals. It is designed to show useful numbers when the source data supports them and to suppress numbers when the data is incomplete or misleading.
First checks
Section titled “First checks”When you open Analysis:
- Confirm QuickBooks is connected.
- Check the latest successful sync timestamp.
- Review the selected period or range.
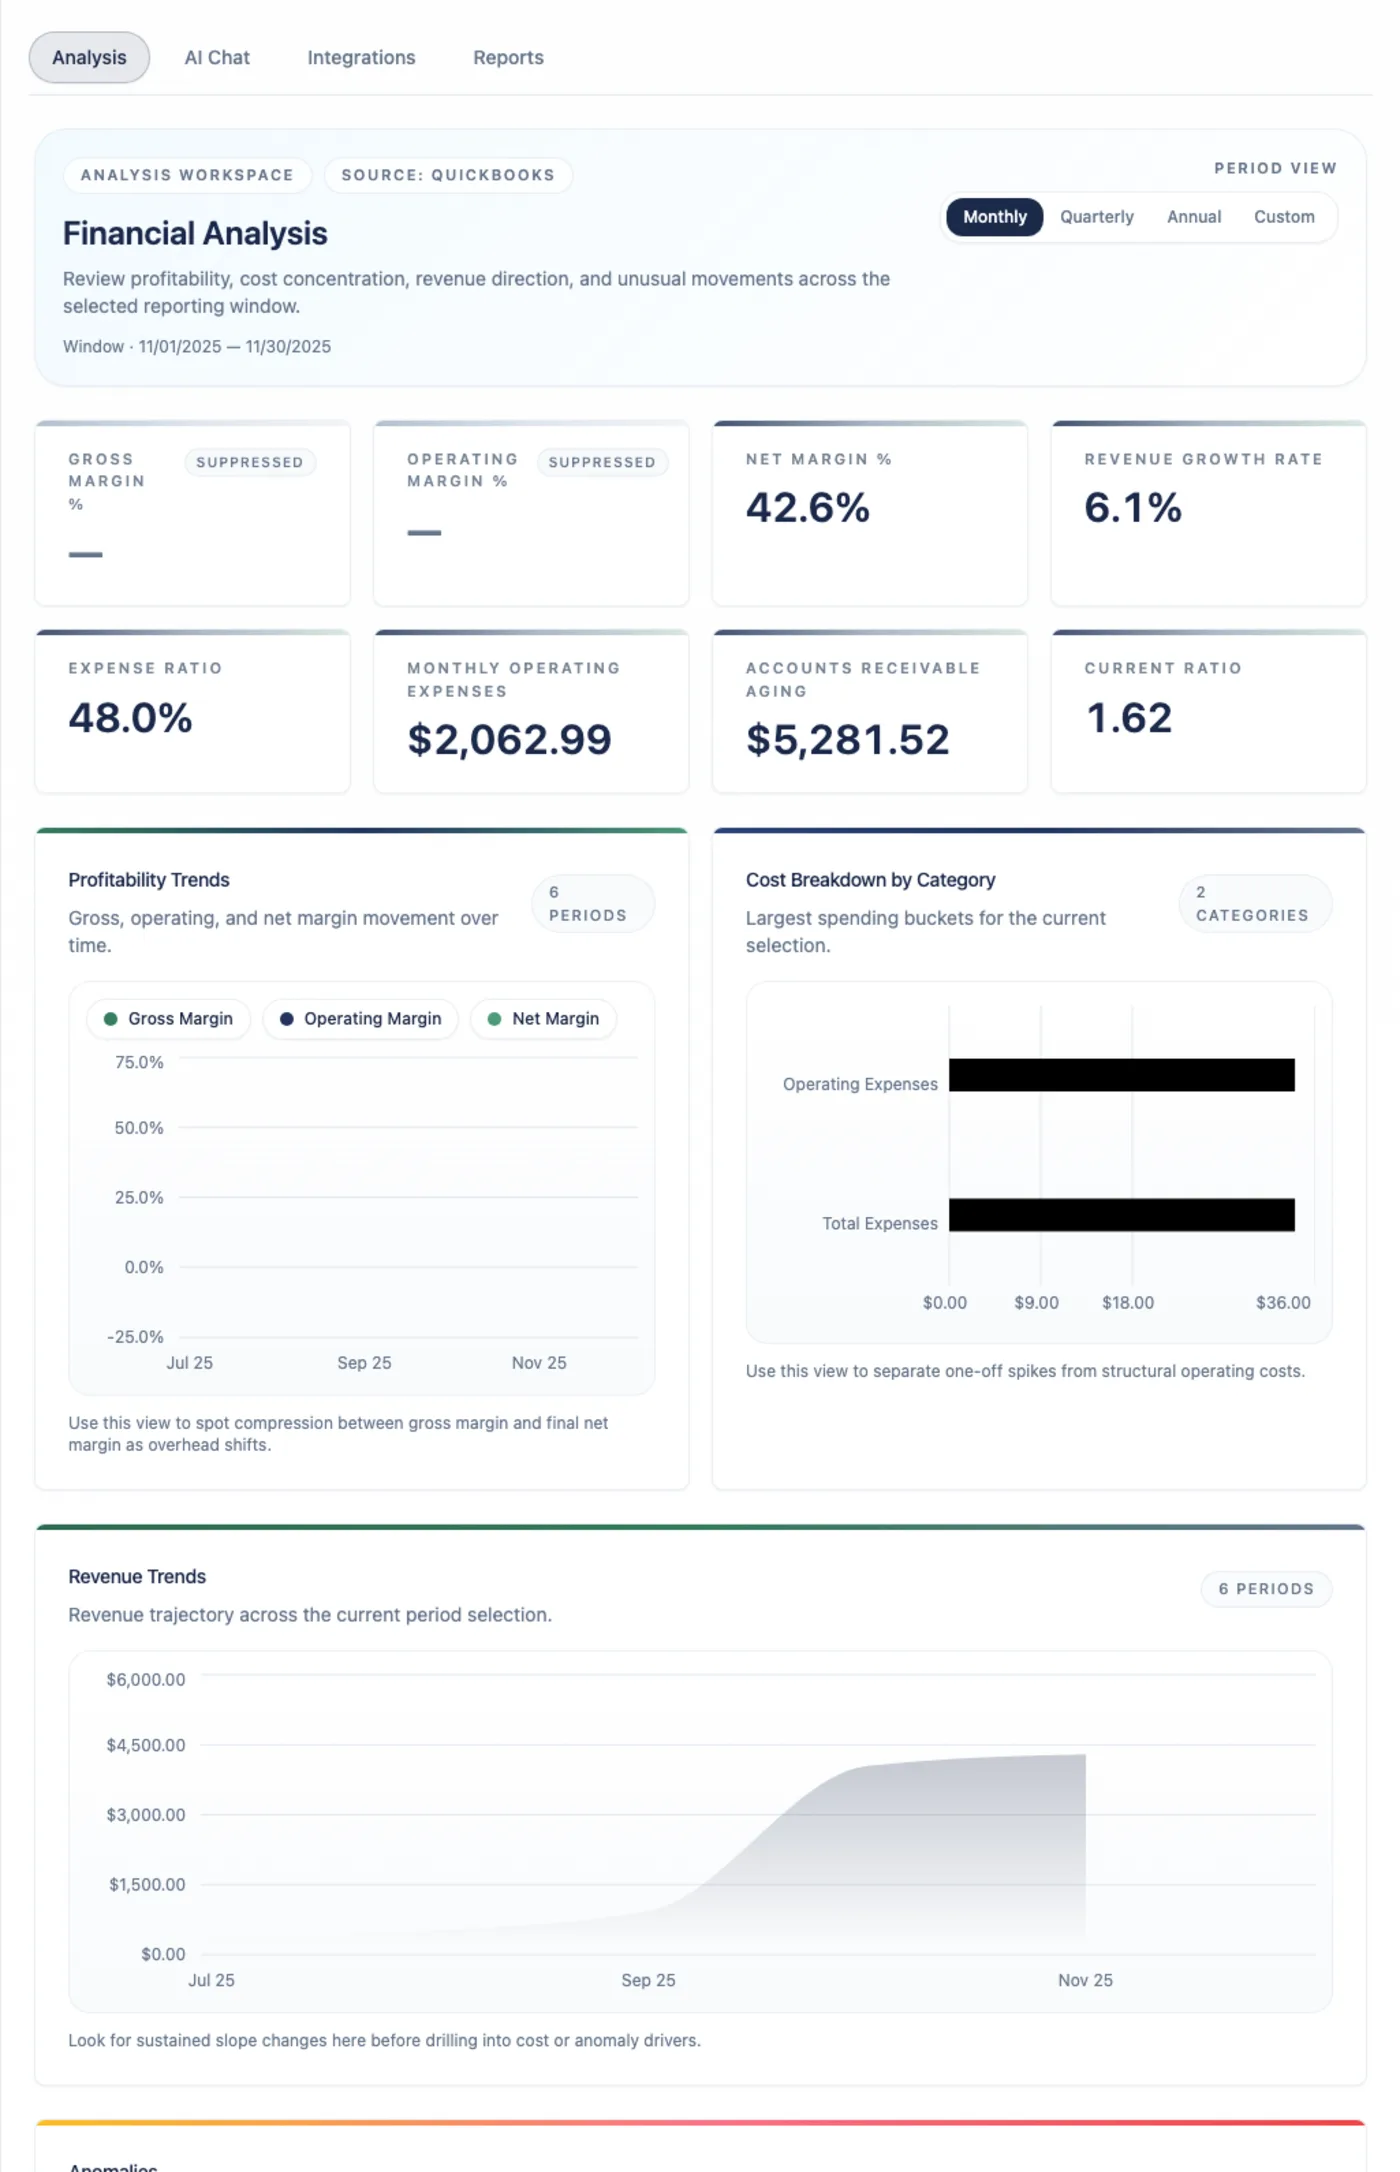
- Scan the KPI cards for values, warnings, or suppressed metrics.
- Open trend and anomaly sections for the drivers behind the cards.
If the tab says no data is available, go to Integrations and connect or sync QuickBooks first.
KPI reference
Section titled “KPI reference”Arboris shows eight KPI cards.
| KPI | Source | Suppressed when |
|---|---|---|
| Gross Margin % | QuickBooks Profit and Loss revenue and COGS. | Revenue is absent, zero, negative, or COGS is absent. |
| Operating Margin % | QuickBooks Profit and Loss revenue, COGS, and operating expenses. | Revenue, COGS, or operating expenses are not sufficient. |
| Net Margin % | QuickBooks Profit and Loss net income and revenue. | Revenue or net income is not sufficient. |
| Revenue Growth Rate | Current period revenue compared with prior period revenue. | Either period is missing or prior revenue is zero or negative. |
| Expense Ratio | Total expenses compared with revenue. | Revenue or total expenses are not sufficient. |
| Monthly Operating Expenses | Operating expenses normalized to a monthly value. | Operating expense data is absent. |
| Accounts Receivable Aging | QuickBooks AR Aging report. | The AR Aging report is unavailable or incomplete. |
| Current Ratio | QuickBooks Balance Sheet current assets and current liabilities. | Balance Sheet data is absent or current liabilities are zero. |
An em dash means unknown. Zero means the source data supports a real zero value. Treat those states differently in client conversations.
Source rules
Section titled “Source rules”QuickBooks financial reports are the authority for statement-based metrics. Arboris does not fill missing Profit and Loss or Balance Sheet values from transaction lines because that can produce numbers that do not match QuickBooks’ accounting engine.
When a source report is missing, incomplete, stale, or not comparable, Arboris suppresses the affected KPI and gives a reason instead of showing a misleading value.
Period controls
Section titled “Period controls”Analysis supports common review ranges such as Latest, Last 3M, Last 6M, Last 12M, YTD, Last Year, and Custom. Trend grouping can be monthly, quarterly, annual, or total where supported.
Only complete accounting periods are used for KPI calculations and comparisons. Partial periods can make operational sense, but they are not used for client-ready KPI conclusions in Arboris.
Trend and reference sections
Section titled “Trend and reference sections”Below the KPI cards, use the expandable sections to understand what changed:
| Section | Use it for |
|---|---|
| Profitability trends | Margin movement across monthly, quarterly, annual, or total groupings. |
| Cost breakdown | Expense category mix and category movement. |
| Revenue trends | Revenue direction and period comparisons. |
| CFO decision surface | Concentration, cash-flow, AR/AP exposure, reconciliation confidence, and source coverage. |
| Anomalies | Statistically unusual items with severity, explanation, and suggested action. |
Charts are for review and interpretation. Use the source coverage and suppression messages when preparing client-facing conclusions.
Anomaly interpretation
Section titled “Anomaly interpretation”Anomaly detection highlights financial movements that differ from history. It is most useful after enough complete periods exist. Seasonal, project-based, high-growth, or very small-sample businesses can create legitimate spikes, so review the source evidence before making a client-facing claim.
Practical review sequence
Section titled “Practical review sequence”- Start with data coverage and sync freshness.
- Review all eight KPI cards, including suppressed metrics.
- Identify the largest revenue, margin, expense, AR, or liquidity changes.
- Open anomalies and distinguish accounting changes from business changes.
- Use AI Chat for a source-grounded explanation of the material changes.
- Export a report only after you understand any suppressed metrics or data gaps.